


Earlier this year, Google rolled out an upgrade to Google Analytics called Enhanced Ecommerce. An addition to Google’s Universal Analytics, this Enhanced Ecommerce tracking offers Google Analytics users access to data that hasn’t been previously available. It includes a complete series of funnel-based reports, additional support for Google Tag Manger, and the use of the Product ID dimension.
Enhanced Ecommerce offers deeper insights into the behaviors of your visitors, enabling you to view traffic from more detailed shopping experience and product perspectives, rather than the traditional page perspective. It also gives you a method to measure the effectiveness of your merchandising, moving the scope of Google Analytics’ beyond transactional data.
The feature will give you a complete picture of customers’ behaviors before they make their purchases as well as after, and allow you determine why users are completing transactions or leaving your eCommerce site before they checkout.
With Enhanced Ecommerce you can:
- Track which products shoppers buy most often and which they abandon most frequently with Product ID dimension. With this information you can focus on pricing and promotion to generate more sales as well as devise strategies to reduce shopping card abandonment.
- Track your customers’ checkout behaviors with shopping funnels you can customize for your check-out process.
- Track users shopping behaviors from beginning to end.
- Track promotions on your sites – Tracking internal promotions (e.g., coupons) and external merchandising efforts (e.g., affiliate sites) can help you understand how effective your marketing is when it comes to generating revenue.
- Track online refunds to get a more accurate idea of the actual revenue for a product or promotion.
- Develop custom product lists and product landing pages so you can determine which lists and products increase user engagement.
Enhance the effectiveness of your merchandising strategy.
Enhanced Ecommerce tracking requires your developers to send extra product and checkout data so Google Analytics can understand it. If you already use Google Tag Manager to track page views you must send eCommerce data via Tag Manager
To Set Up Enhanced Ecommerce Tracking:
- You must be using the Universal Analytics code (analyitcs.js library) on your eCommerce website.
- Enable Enhanced Ecommerce on the view level. To enable it, click the E-commerce Settings for the view you want to enable Enhanced E-commerce for:
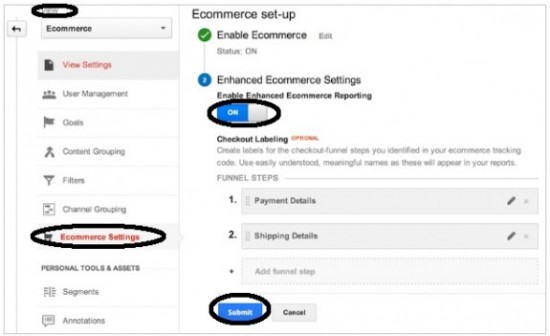
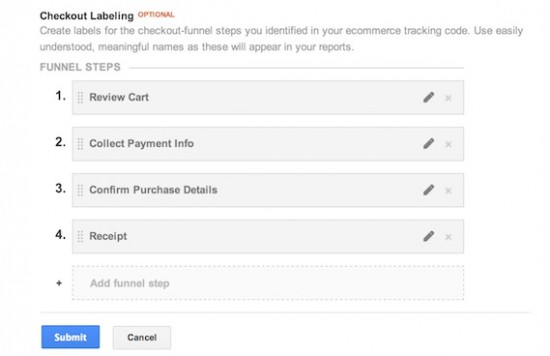
- Choose names for your check-out steps (optional). The checkout funnel report helps you to understand where in the checkout process your customers are dropping off. Knowing the precise drop-off step in the funnel will help you improve your conversion rate.
If you don’t configure check step names, they will appear simply as Step 1, 2, 3, etc.
- 4: Add the tracking code. To enable Enhanced Ecommerce on your online store, you will have to implement the following codes:
- Measuring product Impressions
- Measuring product clicks
- Measuring Addition or Removal of Cart
- Measuring checkout steps
- Measuring transactions
- Measuring Refunds
You can refer to this Google documentation while you’re adding the code.
Google’s Enhanced Ecommerce offers you 10 reports to give you the insights you need to develop the best strategy to increase the revenue of your online store. These reports help you understand performance and activity for individual products or product categories. They also show your customers’ shopping and purchasing behaviors like how often they add or remove products from their online shopping carts.
The reports are:
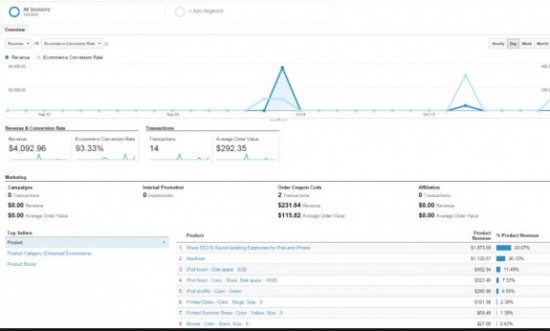
- Ecommerce Overview: Shows you what’s happening in terms of your overall revenue. It will help you understand your total revenue and eCommerce conversion rate with date ranges as well as the total number of transactions, average order values and average order quantities.
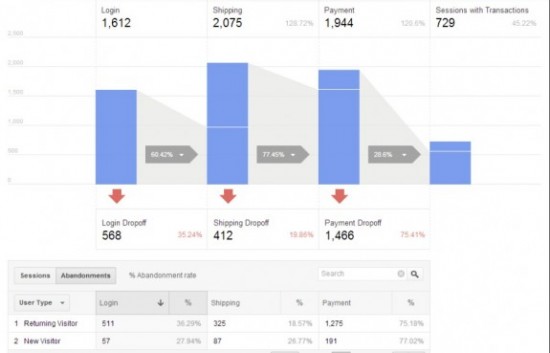
- Shopping Behavior Analysis: Helps you understand where in the funnel customers are dropping off. Each step includes the number of visitors at the top and the number of visitors who abandonment drop off at the bottom.

- Checkout Behavior Analysis: Lets you see how successfully your users moved through your checkout process. The checkout-funnel visualization illustrates how many users moved on from one step to the next, and how many abandoned the process at each step. Analytics determines the funnel steps based on your tagging. You can use the funnel visualization to identify strengths and weaknesses in your checkout funnel.
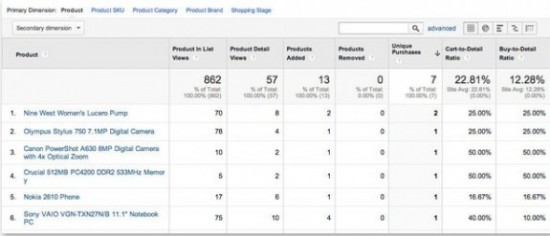
- Product Performance: Enables you to see how your products performed from two different points of view:
- Summary: Product performance in terms of revenue, price, and quantity. Includes two of the Shopping Behavior metrics.
- Shopping Behavior: Product performance in terms of user engagement with your products (e.g., viewing products and details, adding and removing products from carts, completing checkouts).
- Sales Performance: Lets you evaluate sales by transaction (date, time, transaction ID) and date (cumulative transaction data by date). It includes information about revenue (total revenue from eCommerce transactions; depending on your implementation, this can include tax and shipping); the refund amount for any transaction, tax (total tax charges for ecommerce transactions), shipping costs and quantity (number of units sold in ecommerce transactions).
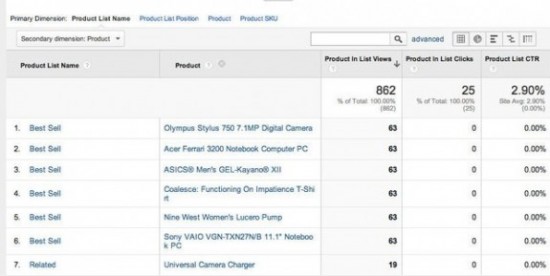
- Product List Performance: Helps you identify which of your product lists are performing and which are not. You can determine how products are performing when they are advertised or grouped with other products. You can use this data to put successful items together for increased revenue. You can use product lists to represent related product pages, catalog pages, search pages, upsell pages, cross sell pages. The following metrics will be available in the report:
- Product list views (number of times users viewed products when they appeared in the product list)
- Product list clicks (number of times users clicked products when they appeared in the product list)
- Product list CTR (the rate at which users clicked the product list to view products)
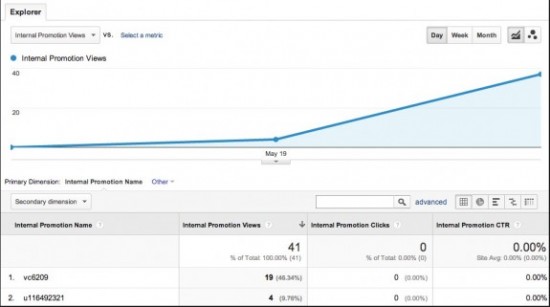
- Internal Promotions: Includes things like banners that you display on one section of your site to advertise another section of your site.
The Internal Promotion report lets you see how your internal promotions performed in terms of the following metrics: - Internal Promotion Views (number of times users viewed internal promotions)
- Internal Promotion Clicks (number of times users clicked internal promotions)
- Internal Promotion CTR (the rate at which users click internal promotions, i.e., views/clicks)
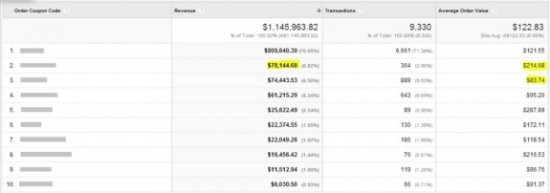
- Order Coupon: Lets you see how your order-level coupons performed in terms of the following metrics:
- Revenue (total revenue from ecommerce transactions; depending on your implementation, this can include tax and shipping)
- Transactions (total number of completed purchases on your site)
- Average Value (average value of e-commerce transactions)
- Product Coupon: Lets you see how your product-level coupons performed in terms of the following metrics:
- Revenue (total revenue from ecommerce transactions; depending on your implementation, this can include tax and shipping)
- Unique Purchases (total number of times a specified product (or set of products) was a part of a transaction)
- Product Revenue per Purchase (average product revenue per purchase)
- Affiliate Code: Enables you to see how your affiliate sites contributed to your eCommerce performance in terms of the following metrics:
- Revenue (total revenue from ecommerce transactions; depending on your implementation, this can include tax and shipping)
- Transactions (total number of completed purchases on your site)
- Average Order Value (average value of e-commerce transactions)

